Covid Dashboard: Project Overview
- Conducted an exhaustive analysis of global COVID-19 mortality trends spanning the years 2019 to 2021, leveraging data from the Our World in Data database.
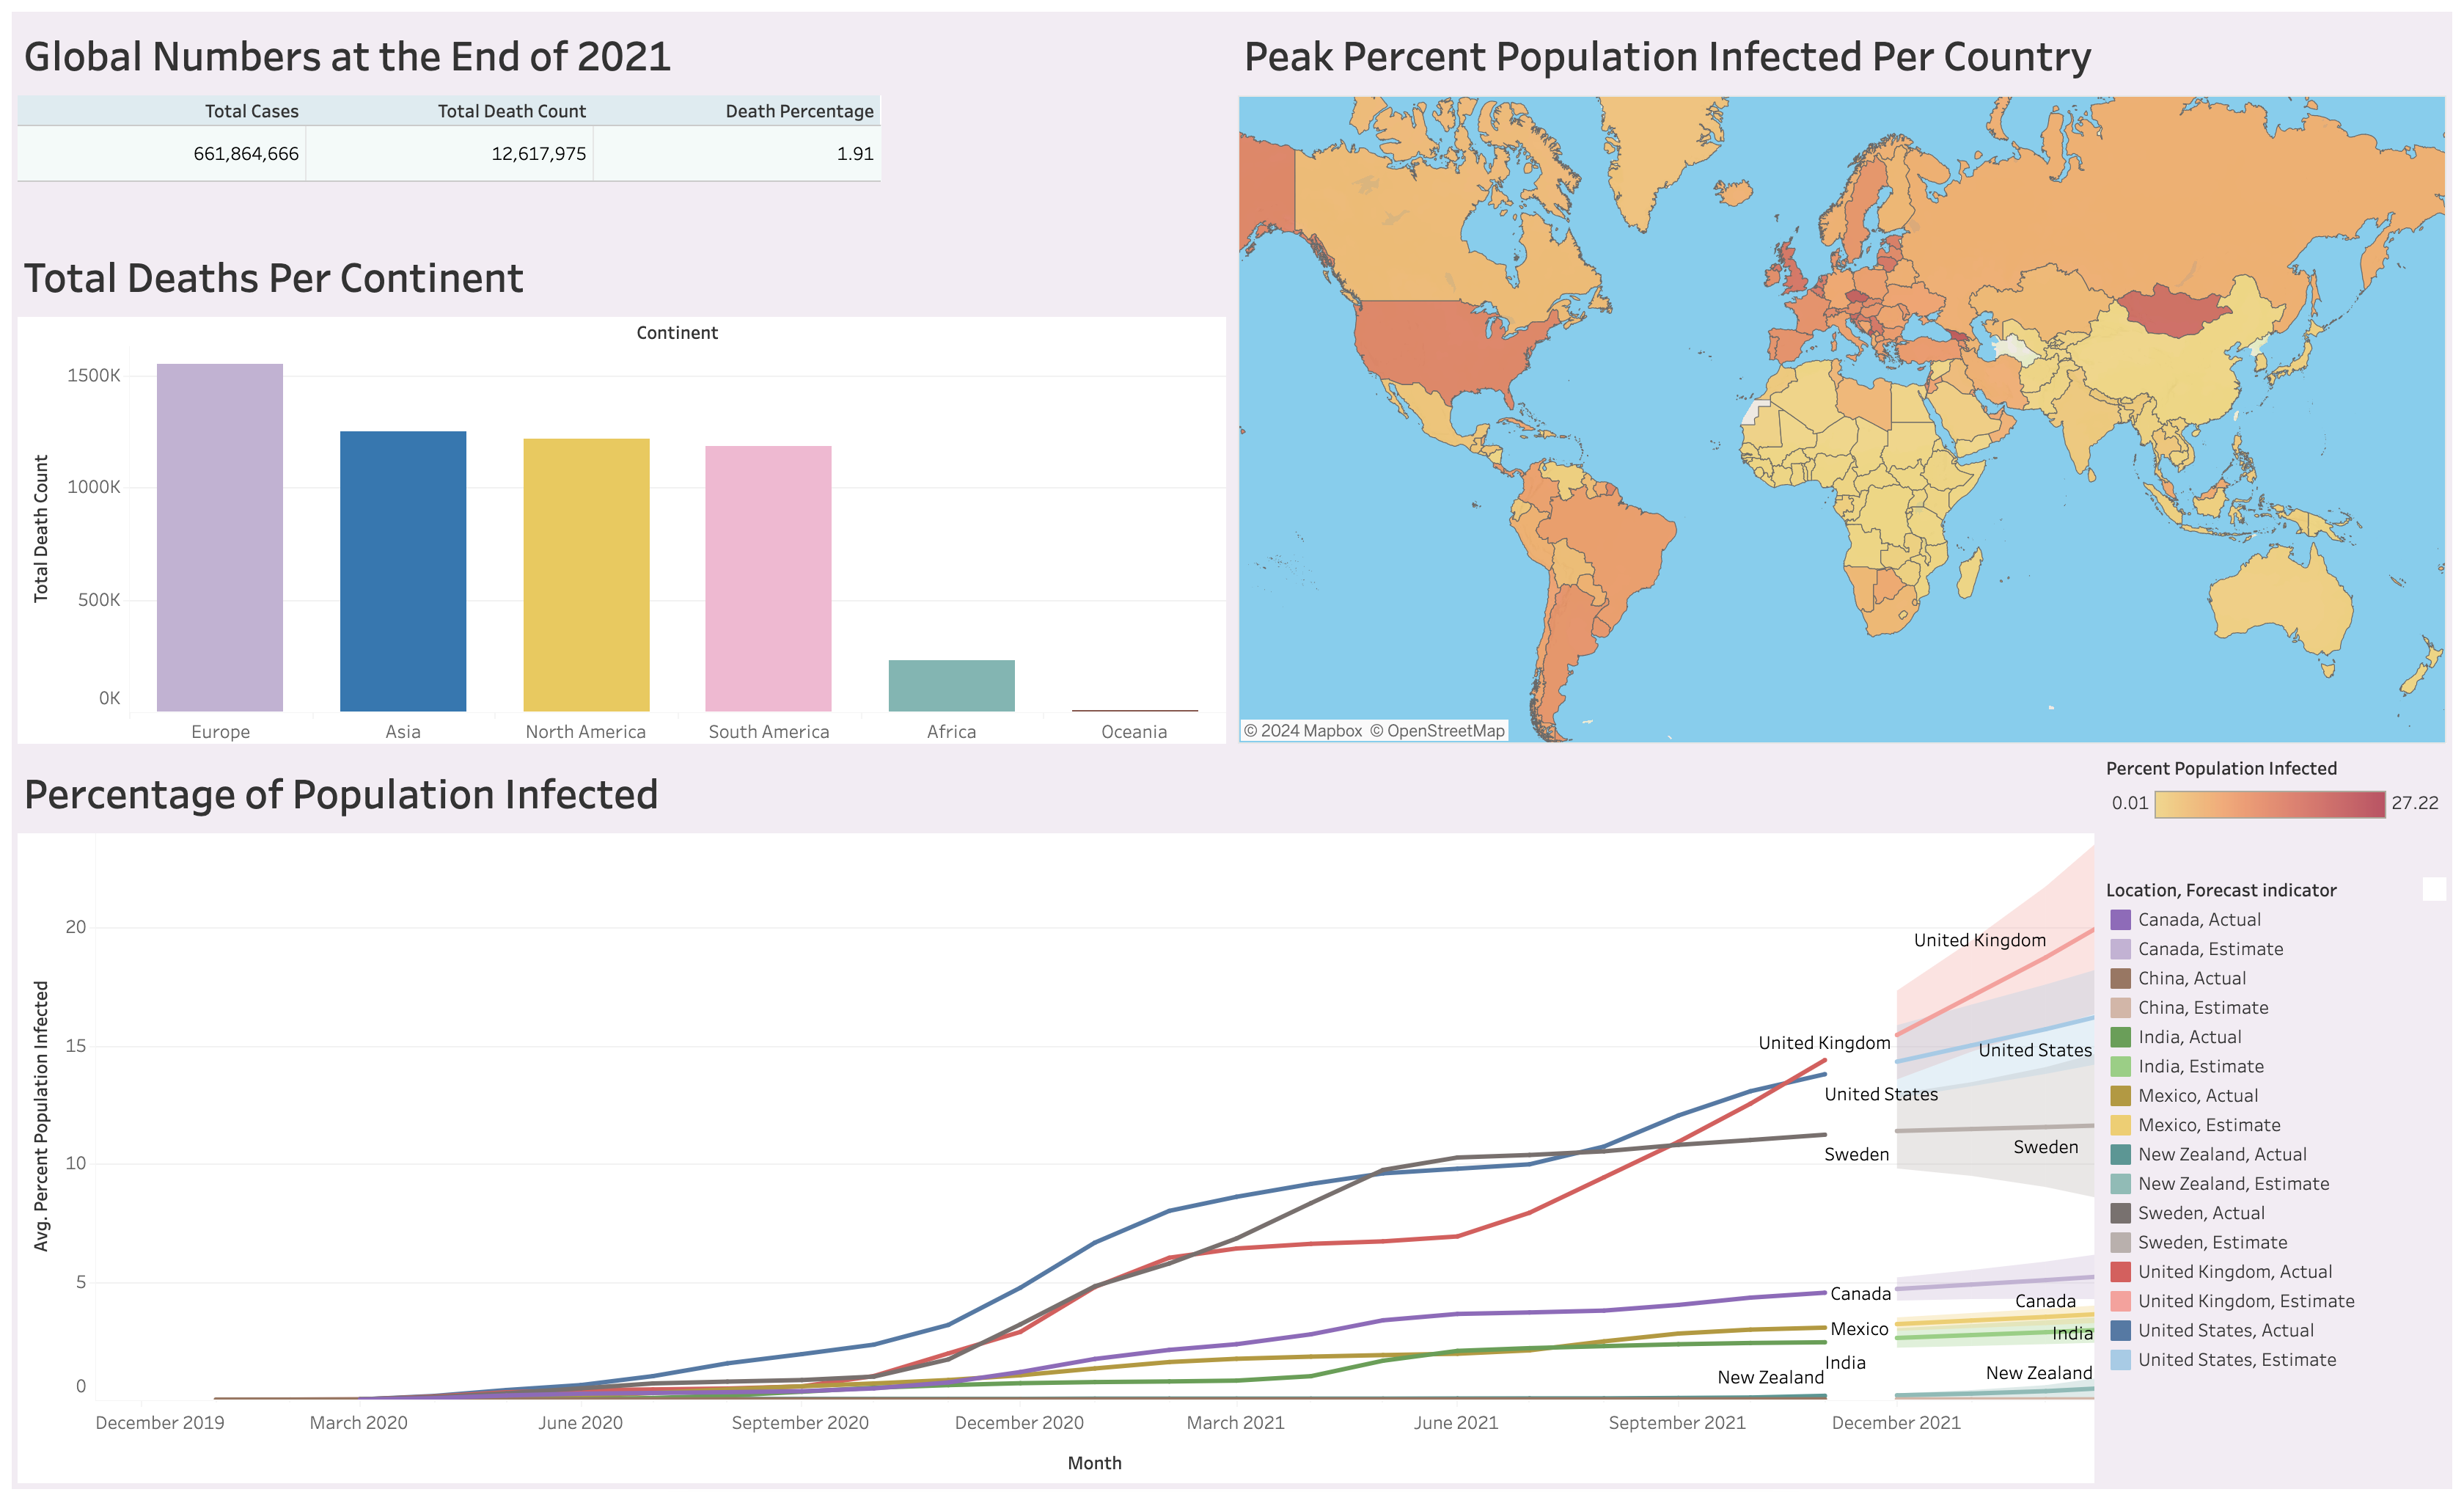
- Orchestrated the development of a Tableau dashboard featuring four strategic queries, extracting critical metrics such as total cases, fatalities, death rates, peak infection counts, population demographics, and infection rates.
- Employed advanced SQL querying techniques to aggregate and dissect COVID-19 data, implementing refined filtering mechanisms by continent and excluding specific locales to maintain data fidelity, while utilizing data visualization tools to articulate actionable insights for policy decision-makers.
Resources
Excel Version: 16.78
mySQL Version: 8.0.32
Data Collection
Dataset was found on World World in Data under the title Coronavirus (COVID-19) Deaths.
Data Cleaning
Since most of the world was less concerned about COVID-19 from 2022 onward, this project only observed data up to the end of 2021. Additionally, the dataset only contained data from the beginning of 2020. For these reasons, the data utilized in this project was confined to 2020 and 2021.
Most of the columns in the dataset were scaled versions of other variables or were not relevant to the project. Therefore, only the following columns were kept: Continent, Location, Date, New Cases, New Deaths, and Population. ‘Location’ usually referred to countries but was sometimes the continent when the ‘Continent’ cell was null. Mathematical operations were conducted to calculate Total Cases, Total Deaths, Death Percentage, Infection Count, and Population Infected Percentage.
The deletion of columns was done in Excel to expedite the import into MySQL Workbench. All other data manipulation was conducted in SQL, as shown here.
Dashboard
The SQL outputs were exported as Excel files before subsequently being imported into Tableau for the creation of the dashboard below.
GitHub Repository for “Covid Dashboard” Project
Back to Data Analytics Portfolio